Data tables
Data tables in PLA 3.0 act as containers for observation data or referenced data. You use them to configure the display of observation data and to set up automated data flows between PLA 3.0 documents, thus minimizing the need for manual interaction.

Data table setup
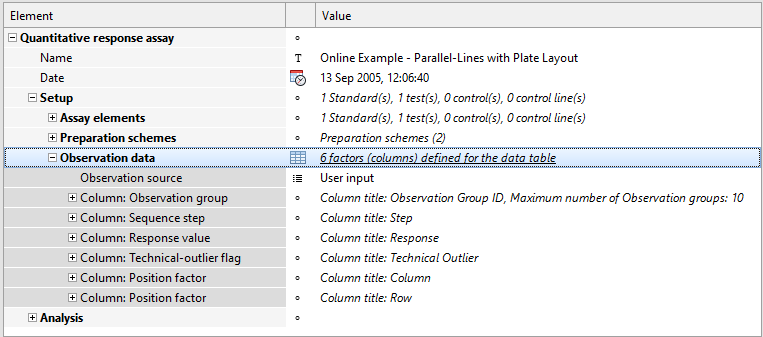
To set up data tables, you use the Content editor.
This editor displays the data table as a sub-node in the document structure. The name of the sub-node depends on the document type. Quantitative response assay documents, for example, use Observation data. Basic bioassay protocol documents use Reportable values, and Combination of microbial assay documents use Potency data.
Data tables offer a number of settings that influence the behavior of data editors, allowing you to adapt the handling of observation data in those editors according to your requirements. For details on each settings, see the respective subtopic.
Data entry
To enter your observation data, you use the various data editors of PLA 3.0.