Observations editor
Use the Observations editor to enter the raw data.

-
Toolbar
-
Data table
-
Work area
Toolbar
| Icon | Name | Description |
|---|---|---|
|
|
Add |
Add a new row of observation data. |
|
|
Remove |
Remove the selected row. |
|
|
Adjust |
PLA 3.0 uses the information you provide in the Content editor to automatically set up the data table. You can adjust your observations after the initial setup, for example, to employ alternate plate layouts, accommodate data acquisition, or correct assignment errors. |
|
|
Move up |
Move the selected row up in the data table. |
|
|
Move down |
Move the selected row down in the data table. |
|
|
Sign |
Apply an electronic signature to the data area. Tip:
To apply a signature to the content area or
the whole document, use the |
|
|
Open externally |
Display your data in your standard
editor for .csv files.
Important: When opening data externally, we
recommend you verify the formatting of the transferred data and
correct the imported values if required. For example, Microsoft
Excel automatically re-formats the ratio 1:50 to the time stamp
1:50:00. |
|
/ |
View options |
Use grid colors for a better identification of your data in the data table. You can apply a coloring scheme based on sequence step, response value, or technical outlier. The lighter the color, the lower the associated value. |
Data table
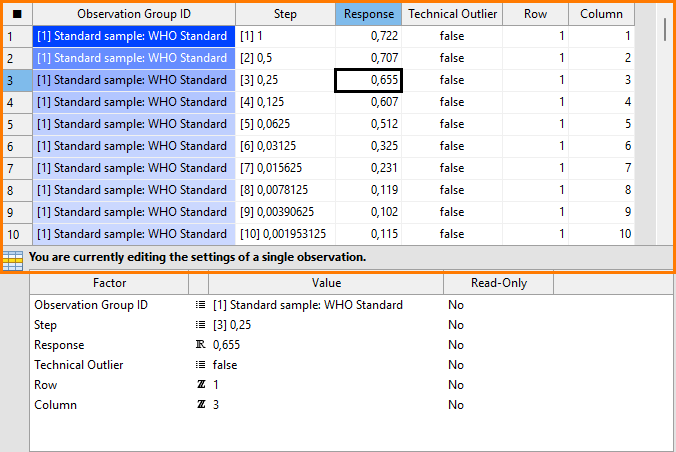
Use the data table to edit a single data entry. The data table of this editor behaves like an Excel sheet and displays your data in a grid-like structure.
Each row stands for one observation, such as a single well from an assay plate or a single tube if your assay consists of racks with tubes. Each column defines the property of an observation (in statistical terms, a factor).

-
Observation group ID column to reflect a specific sample from the assay.
-
Sequence step column to display the concentration.
-
Response column to hold the measurements.
-
Technical outlier column to exclude a certain observation from analysis.
-
Position factor columns to show the position of your samples on the plate.
Note:For some document types, you have to manually add position factor columns. For details, see the Position factors topic.
View annotations
Annotations give more details about specific actions performed on data values. You can view these annotations from any data editor. PLA 3.0 creates annotations for values acquired using a Data Acquisition Module and for values for which the technical outlier state is changed.
You can identify an annotated value by a small blue triangle in the upper left
corner of the data cell. To view the annotation, select ![]() Show annotations from the context menu of the data
cell.
Show annotations from the context menu of the data
cell.
Copy and paste data
| Icon | Option | Description | How-to |
|---|---|---|---|
| Cut | Cuts the data from one or more cells, rows, or columns and transfer it to another data editor, another document, or an external program. | Right-click the data you want to cut and select Cut from the context menu. | |
| Copy | Copies your data between data editors, to another document, or an external program. | Right-click the data you want to copy and select Copy from the context menu. | |
| Paste | Pastes data you cut or copied before to another data editor, or an external program. | Right-click the position where you want to paste the data and select Paste from the context menu. | |
| Delete | Deletes one or more values from one or more cells, rows, or columns, provided the cells form a rectangular shape. | Right-click the data you want to delete and select Delete from the context menu. |
Work area
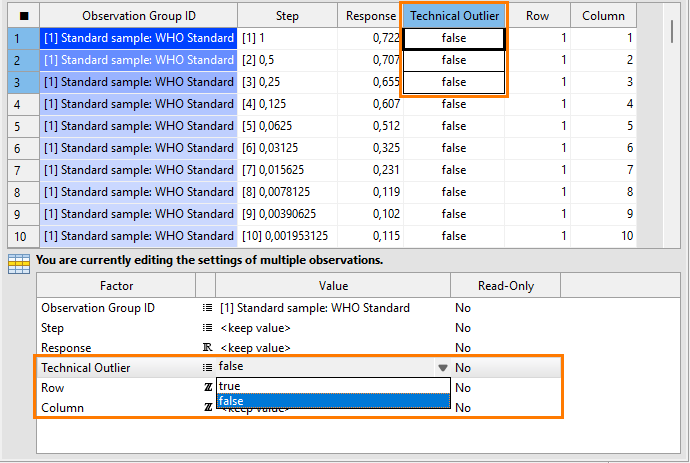
The work area shows details of the entries you selected in the data table. Use this area to work on multiple entries at the same time (multi-cell editing).

