Report groups
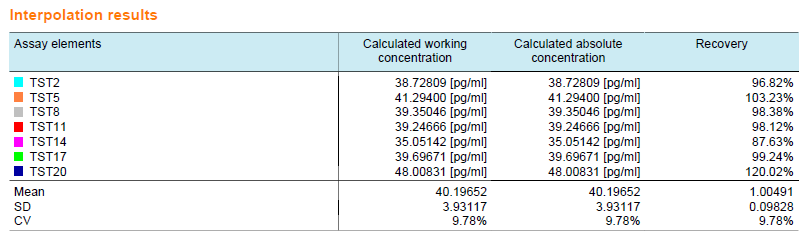
Report groups support you in organizing your samples for unified reporting and result interpretation. You can combine related samples in spike-and-recovery analysis and assay optimization or create summary statistics for interpolated values and dose-response curve characterization.
![]()
About report groups
Report groups let you combine test and control samples into logical groups for unified reporting purposes and subgroup analysis. This can make your reports easier to interpret, especially in complex assays with multiple samples and experimental conditions.
By grouping samples, you can:
-
Simplify the presentation of results by reporting the results of related samples together. For example, you can create a report group for all samples spiked at the same level.
-
Create overlay plots that visually compare curves from grouped samples. For example, you can create a report group for all samples with the same preparation.
PLA 3.0 reports results both for the group as a whole and for each sample. This approach lets you view both the unified outcome and the individual performances, offering both overview and detail at a glance.
Work with report groups
For details on how to create and work with report groups, see the Create and assign report groups topic.