Subgroup analysis
Group your samples, for example, in spike-and-recovery analysis or assay optimization, or to create statistics for interpolated results and dose-response curve characterization.
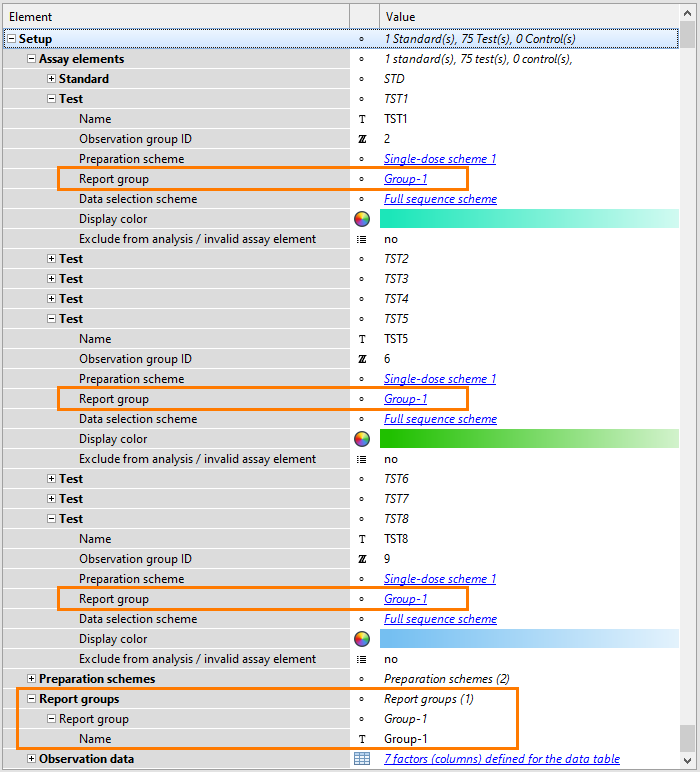
To define subgroups in your experiments, assign report groups to assay elements. In the following example, Test samples TST1, TST5, and TST8 are assigned to the same report group.

Note: Subgroups are available for both, single- and multi-dose samples. For
Standard samples, subgroups are not available.
Calculate the document and create a report to view the statistics of interpolated results and fit parameters. For each group of samples, one plot is created. The following image shows statistics of Test samples assigned to the same report group:

