Observation data
Observation data as such refers to the original and unprocessed data that you collect or generate during the operation of your analytical methods. For the Quantitative response assay document type, observation data is also used as the name of the data table that you use to prepare your Quantitative response assay document for processing.
Preparing a Quantitative response assay document for the processing of observation data is a two-step process. You first set up the document according to your requirements. In the second step, you enter your observation data.
Document setup
For this step, you use the Content editor, your main editor for all document types.
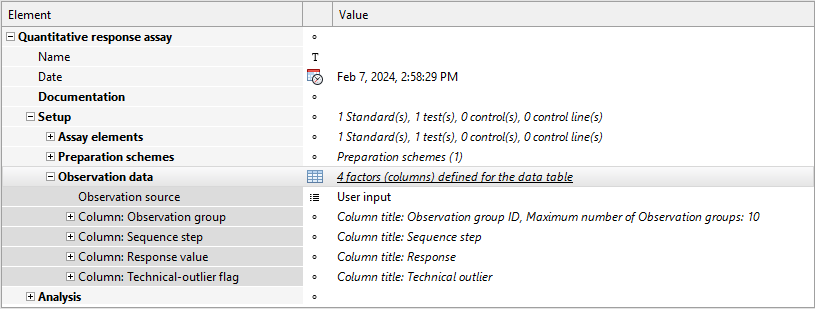
In this editor, you describe your observations using factors. Quantitative response assay documents come equipped with a default set of factors. You can add any number of factors, configure them as you require, and rename them to reflect your preferences.
Use the observation source setting to configure how you obtain your observation data. You can enter data manually or aggregate it from other PLA 3.0 documents. The observation source you select influences which data editors you use to enter your observation data. Quantitative response assay documents are optimized for manual user input.

The columns you define influence the behavior of data editors, allowing you to adapt the handling of observation data in those editors according to your requirements. For details on data tables and how to configure them, see the Data tables topic.
Data input
For this step, you use the Observations editor, where you enter your observation data in a statistical manner.
-
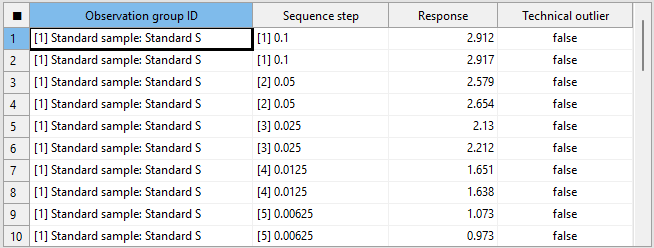
Each row in this editor represents one observation. For example, a 96-well plate should have 96 rows.
-
Each column in this editor represents one of the factors you set up. Thus, when setting up your document, you automatically prepare it for data input.
Each assay element has a unique observation group ID assigned, linking the assay element to its respective observation data in the data editors. To switch plate positions for your samples, simply reassign the respective assay elements to a different observation group ID.
The following figure shows the default columns of a Quantitative response assay in the Observations editor:

