Regression model
Select a regression model to accurately quantify endotoxin levels by fitting a logistic curve or a straight line to the assay data of your bioMérieux endotoxin detection assay.
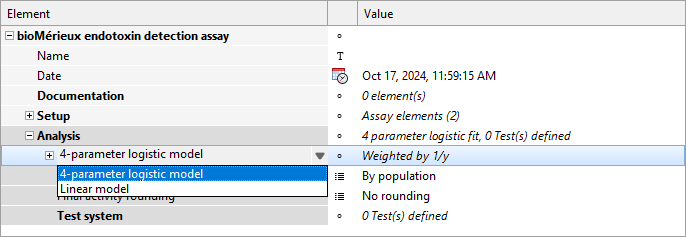
4-parameter logistic model
Use the 4-parameter logistic model to let PLA 3.0 determine the regression curve using the measured RFU values at the nominal concentration of the Standard sample.
The model is defined by the following equation:
The regression model is fitted using weighted regression with either 1/y or 1/y2 weights.
- dRFU
- Delta relative fluorescence units (dRFU or ΔRFU) represent the change in fluorescence intensity over time or between conditions in an assay. Delta relative fluorescence units are used to quantify reaction kinetics or signal differences.
Linear model
Use the linear model to let PLA 3.0 determine the regression curve using the adjusted RFU values at the nominal concentration of the Standard sample.
When using this regression model, a Blank control sample for calculating the net dRFU is required. The net dRFU is the difference between the dRFU and the mean dRFU of the this blank.
The model is defined by the following equation:
- Net dRFU
- Net delta relative fluorescence units (net dRFU or net ΔRFU) represent the change in fluorescence intensity after subtracting background fluorescence (delta relative fluorescence units of the blank control). Net delta relative fluorescence units are used to quantify specific signal changes in an assay.