Use case: Determine insulin concentration in mouse convulsion
Caused by high blood sugar level, leg cramps are a common side effect of diabetes. This effect can be countered by administering insulin, which lowers the blood sugar level. As a too high dose of insulin can also cause leg cramps, it is crucial to find the correct concentration.
Overview
For this use case, you work with an assay with one Standard and one Test sample. Both samples are set up with one replicate. The absolute potency is defined by a stock solution of 20 IU/ml.
-
The Standard sample with values 3.4, 5.2, 7, 8.5, 10.5, 13, 18, 21, 28.
-
The Test sample with values 6.5, 10, 14, 21.5, 29.
Steps

You begin by creating a new Dichotomous assay document. In the next steps, you use the Content editor to set up the preparation schemes and the assay elements for your samples, followed by the setup of the test system. In step five, you use the By Sequence editor to enter your observation data. As the last step, you calculate the reportable values for your assay.
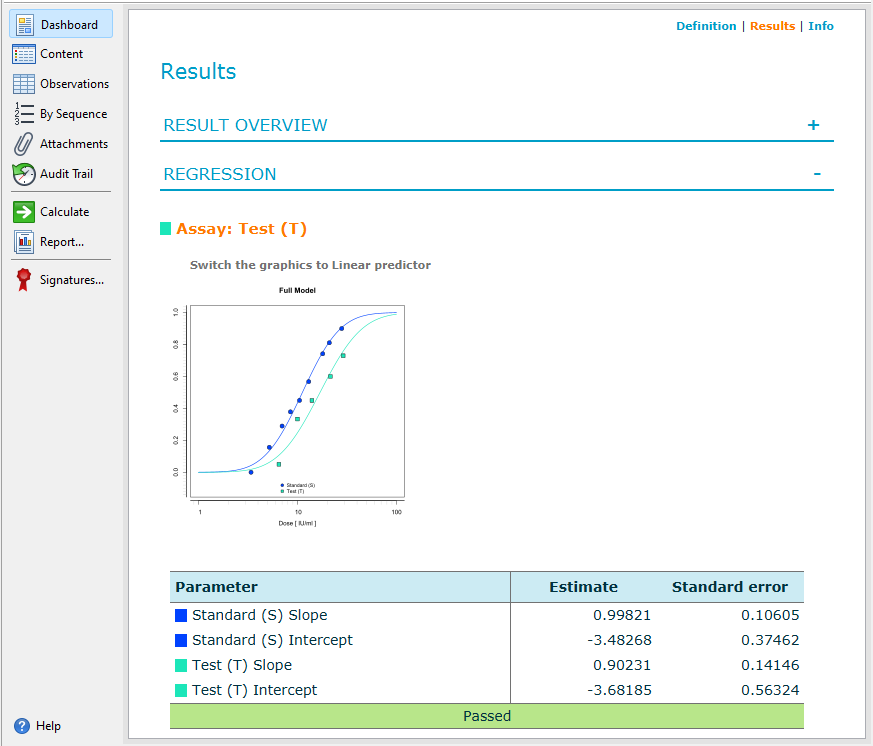
Results
Once calculated, you can access the document dashboard to view key document attributes, a graphical summary of the calculation results, and a representation of the plate layout you used for the assay.
To open the dashboard of a document, on the action bar, select ![]() Dashboard. For
details on how to work with the dashboard, see the Dashboard
topic.
Dashboard. For
details on how to work with the dashboard, see the Dashboard
topic.
Reporting
Create reports to download and share your assay results. PDF reports contain the data available on the dashboard, enriched with details like the database that holds the document, and detailed calculation results for each assay element. Use CSV reports to export your assay data for further processing.
To generate a report for a document, on the action bar, select ![]() Report. For details on how to work
with reports, see the Create reports topic.
Report. For details on how to work
with reports, see the Create reports topic.