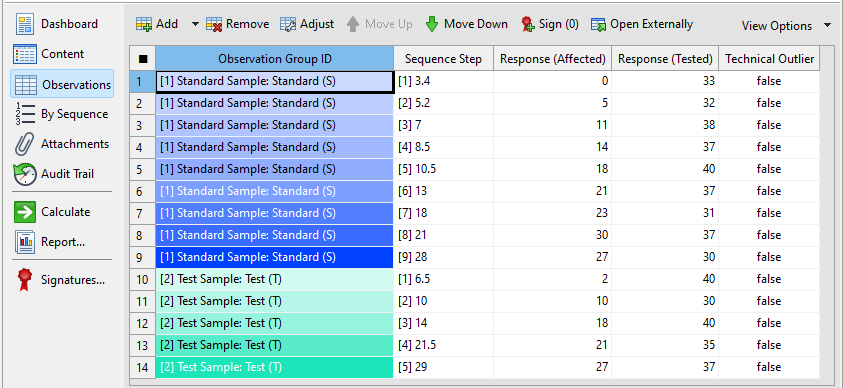
Enter the observation data
Enter the affected and tested response values.
Before you begin
Procedure
To enter your observation data for the Standard sample:
- In the By Sequence editor, select [1] Standard Sample: Standard (S) as the observation group.
- Select Response (Affected) as the primary display factor.
-
Add the following response values:
Response (Affected) [1] 3.4
0
[2] 5.2
5
[3] 7
11
[4] 8.5
14
[5] 10.5
18
[6] 13
21
[7] 18
23
[8] 21
30
[9] 28
27
- Select Response (Tested) as the primary display factor.
-
Add the following response values:
Response (Tested) [1] 3.4
33
[2] 5.2
32
[3] 7
38
[4] 8.5
37
[5] 10.5
40
[6] 13
37
[7] 18
31
[8] 21
37
[9] 28
30
To enter your observation data for the Test sample:
- Select [2] Test sample: Test (T) as the observation group.
- Select Response (Affected) as the primary display factor.
-
Add the following response values:
Response (Affected) [1] 6.5
2
[2] 10
10
[3] 14
18
[4] 21.5
21
[5] 29
27
- Select Response (Tested) as the primary display factor.
-
Add the following response values:
Response (Tested) [1] 6.5
40
[2] 10
30
[3] 14
40
[4] 21.5
35
[5] 29
37
- Save the document.
Result

