Monitor effective and interpolated concentrations
Monitor the EC50 of a dose-response analysis together with the interpolated Test sample concentrations. Monitor the effective and interpolated concentrations for individual days, and employ a sidechart that provides the mean EC50 and a three-sigma interval for the EC50.
The following images from the '06 Monitoring EC50 And Sample Results from DRA Assays' sample document show how you can employ the chart elements data series, intervals, and sidecharts to compare the interpolated concentrations of Test samples with each other and with the EC50 estimate of the Standard sample.
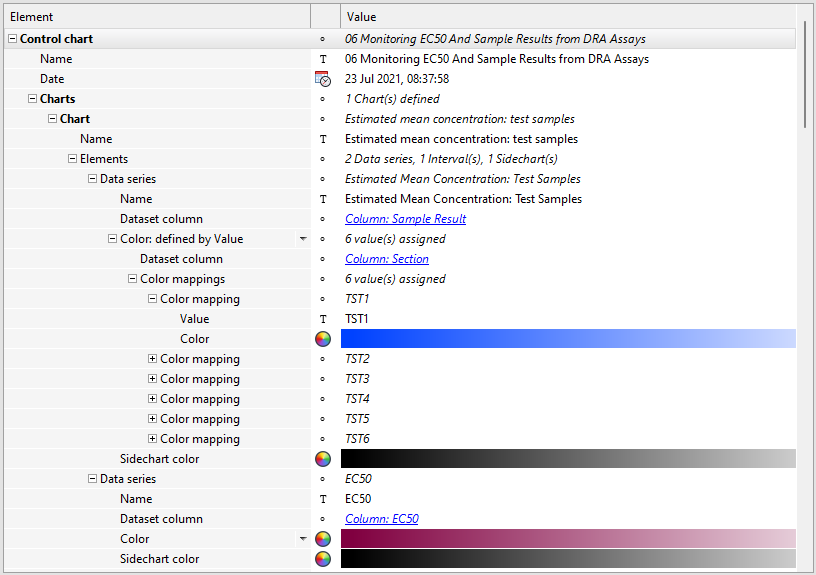
Setting up the data series
Two data series are set up. The first data series monitors the interpolated concentration of each Test sample and applies a different color to each Test sample. The second data series monitors the EC50 value.

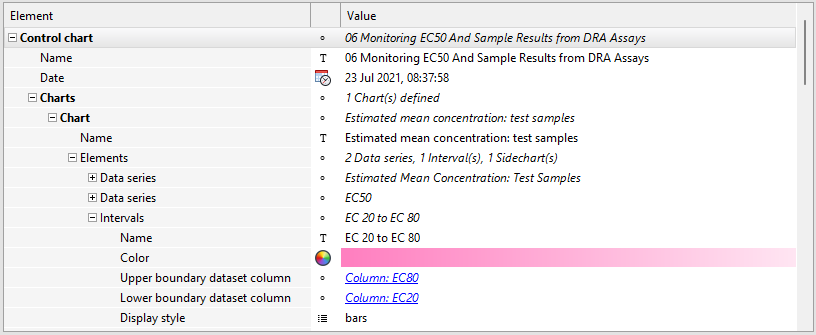
Setting up the interval
Interval boundaries for effective concentrations of 20 and 80 are added to visualize the distribution of the interpolated Test sample values in the resulting chart, employing bars.

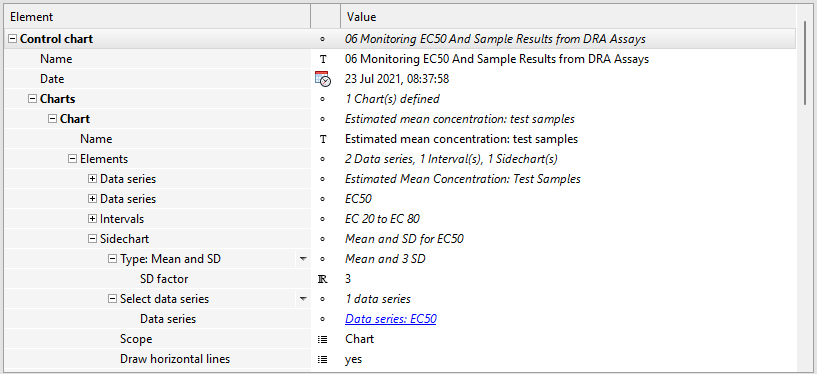
Setting up the sidechart
A sidechart provides the mean and standard deviation of the EC50 values.

Result
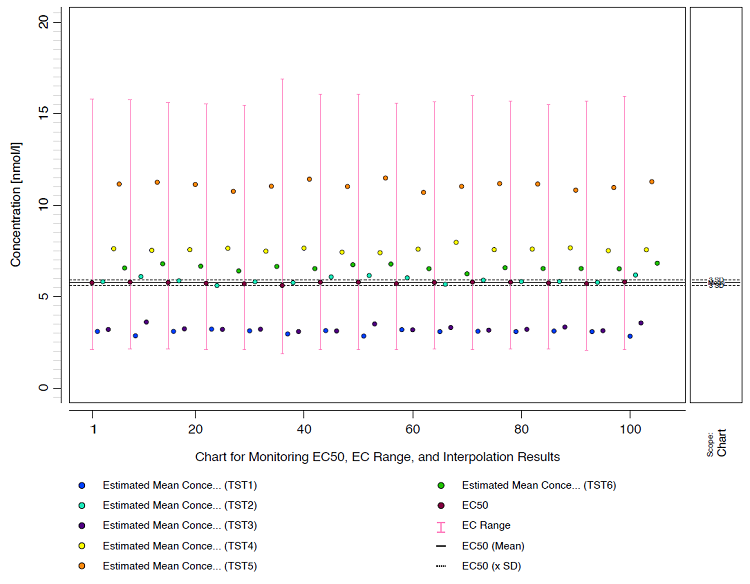
In the resulting plot, the interpolated concentrations of Test samples and EC50 values are plotted as shown below. Intervals are added for improved readability.

