Monitor the effect of a cell culture change
Create events for the dates on which you changed the cell culture and reference the events in rule sets to define the periods you want to monitor.
Setting up events and rule sets
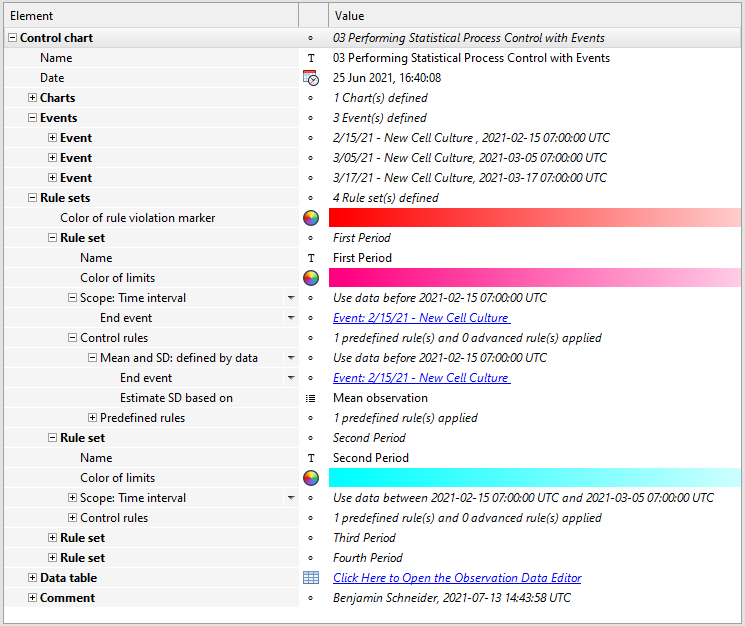
The following image from the '03 Performing Statistical Process Control with Events' sample document shows how you can use events to mark the dates on which you changed the cell culture. To refine the setup, the events are referenced in rule sets.
-
Scope: Time interval: The events are referenced as end events of a time interval to create four consecutive periods. This allows you to restrict the application of a rule set to the specified time interval.
-
Mean and SD: defined by data: The events are referenced as end events in a control rule. This allows you to calculate the mean and standard deviation based on observations from the specified time interval.

Selecting the monitored parameter
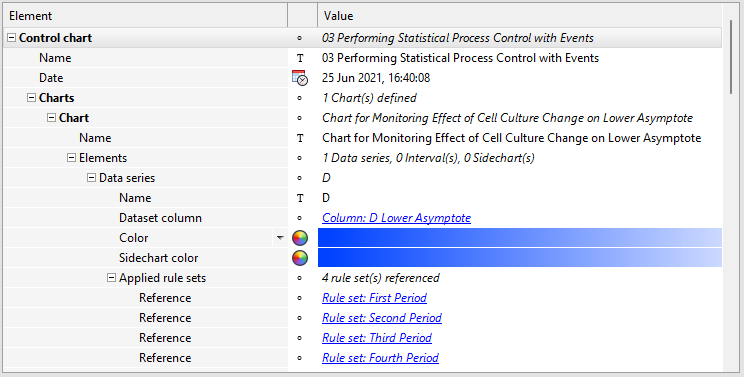
The monitored parameter (in this example the lower asymptote or D parameter of the four parameter logistic regression) is set in the data series of the chart by adding a reference to the floating-point number column 'D Lower Asymptote' of the data table to the Dataset column.

Result
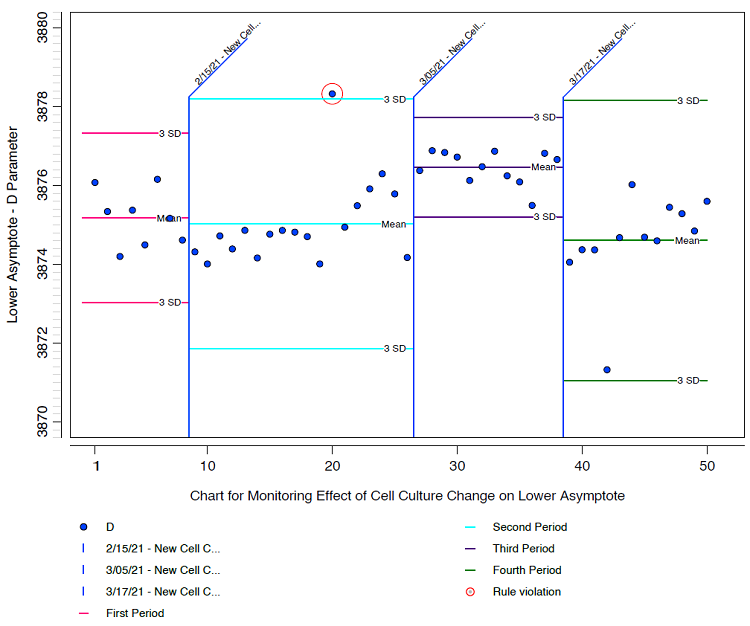
In the resulting plot, the events are indicated as vertical lines. Nelson rule 1 is set as the control rule in all rule sets. But as each period references a different set of observations, the control limits vary.

