Control charts
Use Control chart documents to set up your statistical process control mechanisms.
Document structure
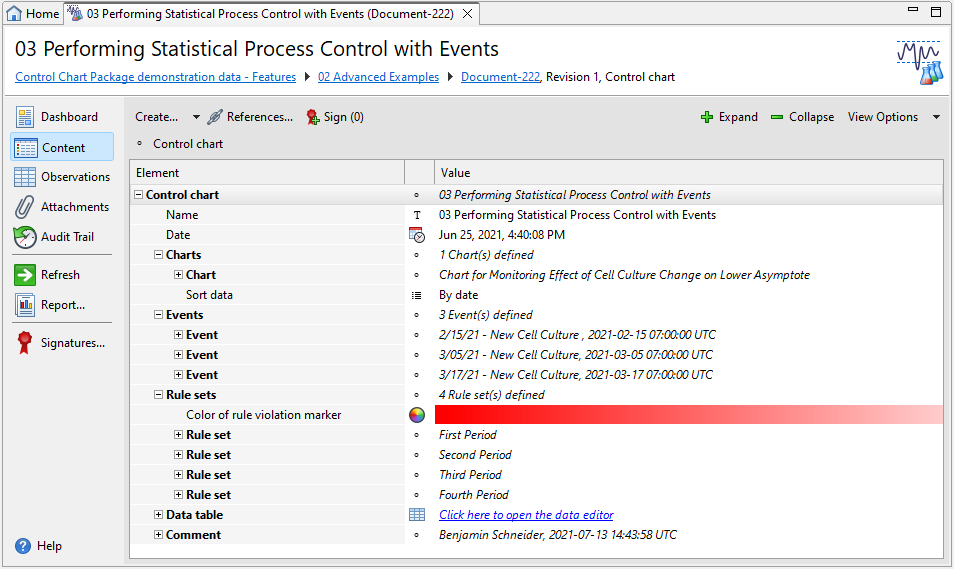
Each Control chart document has two default sections, that is, Charts and Data table, plus one Events, Rule sets, and one or more optional Comment sections.

| Section | Description |
|---|---|
|
Charts |
Lets you add charts to the document. You have to add at least one chart. For details on the available settings, see the Chart elements and Subcharts topics. |
|
Events |
Lets you specify events that may affect the data you want to monitor in this Control chart document. For details on the available settings, see the Events topic. |
|
Rule sets |
Lets you define rule sets to be applied to monitor data in this Control chart document. For details on the available settings, see the Rule sets topic. |
|
Data table |
Lets you adjust the dataset structure used to generate the charts. |
|
Comment |
Add extra information to your assay. The PDF reports display the comments you add on the first page. You can use a simplified Wiki notation for the text. For details on the Wiki notation, see the Simplified Wiki notation topic. |
