Subcharts
By default, all observations of a data table column are plotted in the same chart. You can split one chart into several subcharts or plot only a subset of data in subcharts.
Create subcharts
You can configure subcharts based on a specific number of observations (Observations per subchart) or a specific number of days (Days per subchart). The system automatically calculates the required number of subcharts.
-
Observations per subchart: If the total number of observations is 1000 and you configure 100 observations per subchart, ten subcharts are generated.
-
Days per subchart: If your observations comprise one week, you can create one subchart for each day by entering '1' as the value.
Plot a subset of data
Instead of plotting all your observations, you can plot only a subset of data. You can plot the most recent observations in your data table (Most recent observations) or the observations with the most recent date (Most recent days).
The following example shows six observations. If you plot the three most recent observations, the subchart contains observations 4 to 6. If you plot the three most recent days, the subchart contains observations 1 to 3.
| Identification | Date/Time | A Parameter - D Parameter | |
|---|---|---|---|
|
1 |
Simulated Assay (1 of 1000) |
Mar 12, 2021, 8:48:17 AM |
4315.611464 |
|
2 |
Simulated Assay (2 of 1000) |
Mar 11, 2021, 8:48:17 AM |
4349.653186 |
|
3 |
Simulated Assay (3 of 1000) |
Mar 10, 2021, 8:48:17 AM |
4391.591726 |
|
4 |
Simulated Assay (4 of 1000) |
Feb 26, 2021, 8:48:17 AM |
4328.490556 |
|
5 |
Simulated Assay (5 of 1000) |
Feb 26, 2021, 8:48:17 AM |
4341.526102 |
|
6 |
Simulated Assay (6 of 1000) |
Feb 26, 2021, 8:48:17 AM |
4404.020158 |
Dashboard
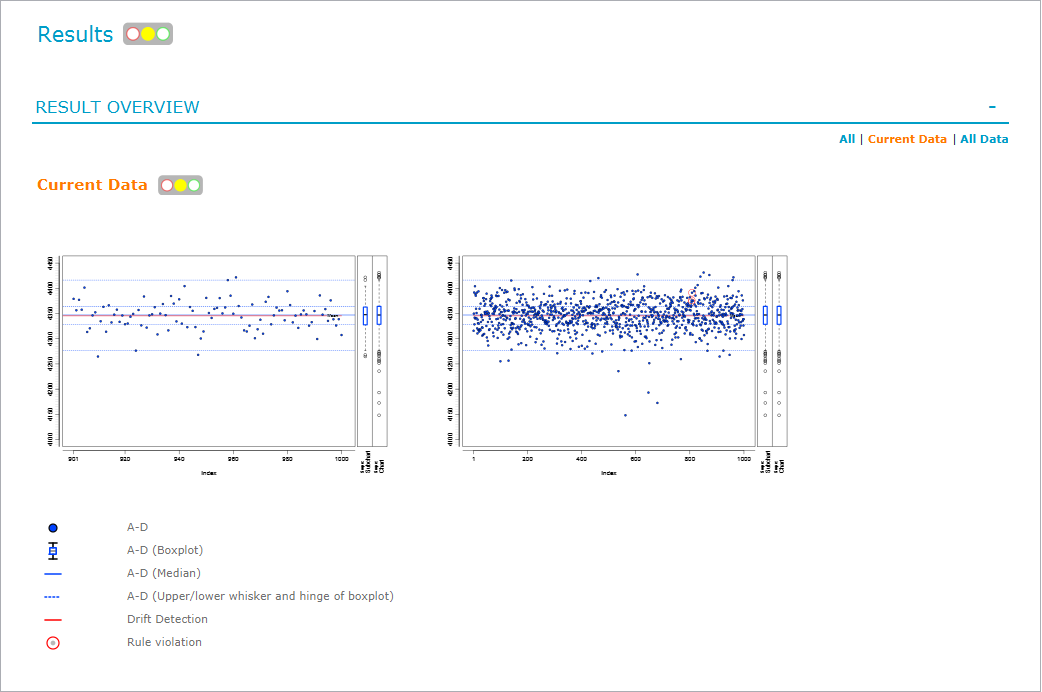
On the Dashboard, the Results overview displays one tab for each chart you configure. On each chart tab, the most recent subchart, as well as the full chart, are displayed. The full report shows all available charts.
The following figure shows the Dashboard of the '03 Splitting the Chart into Subcharts' sample document, with the Current data chart in focus.

