Apply colors based on secondary characteristics
Color your observations depending on a secondary factor not shown in the plot. You can apply colors based on thresholds or utilizing an independent text column.
The following images from the '01 Coloring by Secondary Characteristic' sample document show how you can use a secondary column to map colors to a monitored parameter. The monitoring is set up by referencing the respective parameter in the Dataset column of the data series. In the following examples, the Relative Potency' floating-point number column is monitored.
The colors are applied based on a threshold value or utilizing a manually added text column.
Applying colors based on a threshold
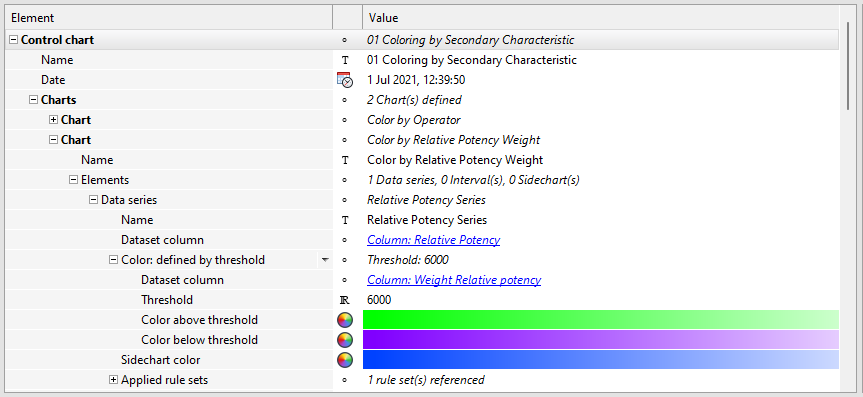
This setup uses the Color: defined by threshold option. The Weight Relative Potency floating-point number column of the data table is used as the color-related parameter and is set by adding a corresponding reference to the Dataset column of the Color: defined by threshold node.
Individual colors are defined for values above and below the threshold.

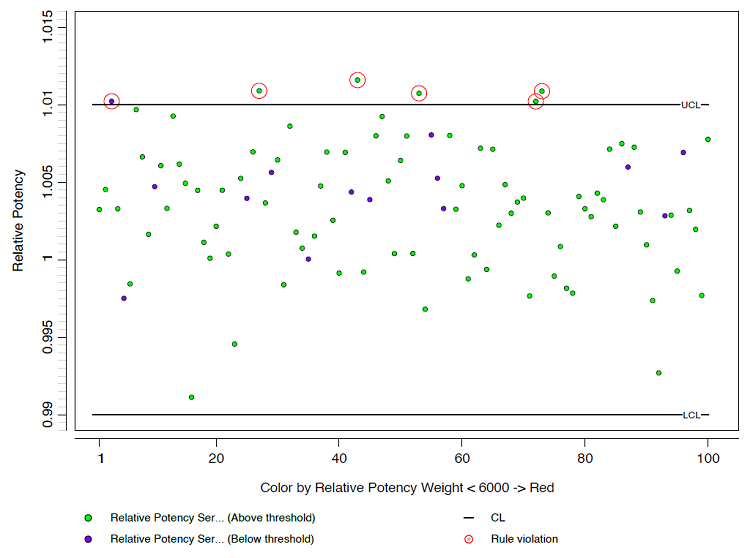
In the resulting plot, the values above and below the threshold value are plotted in the corresponding color.

Applying colors based on a text column
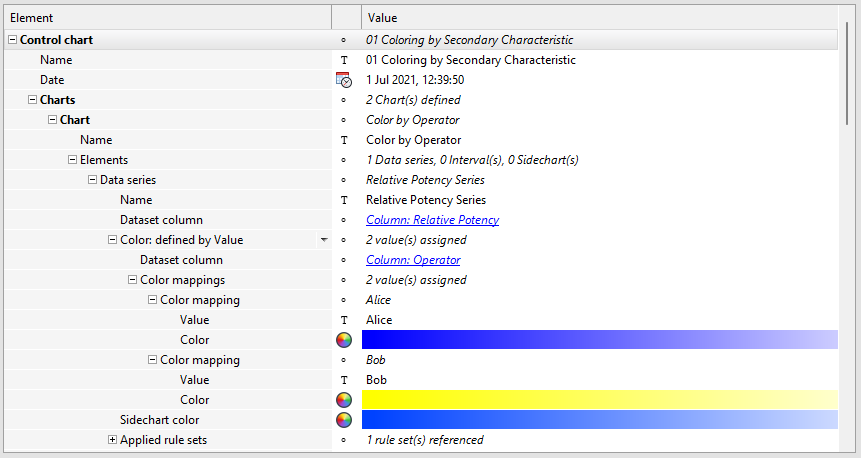
This setup uses the Color: defined by Value option. The Operator single line text column of the data table is used as the color-related parameter and is set by adding a corresponding reference to the Dataset column of the Color: defined by value node.
For each operator, a color mapping is applied based on the name of the operator.

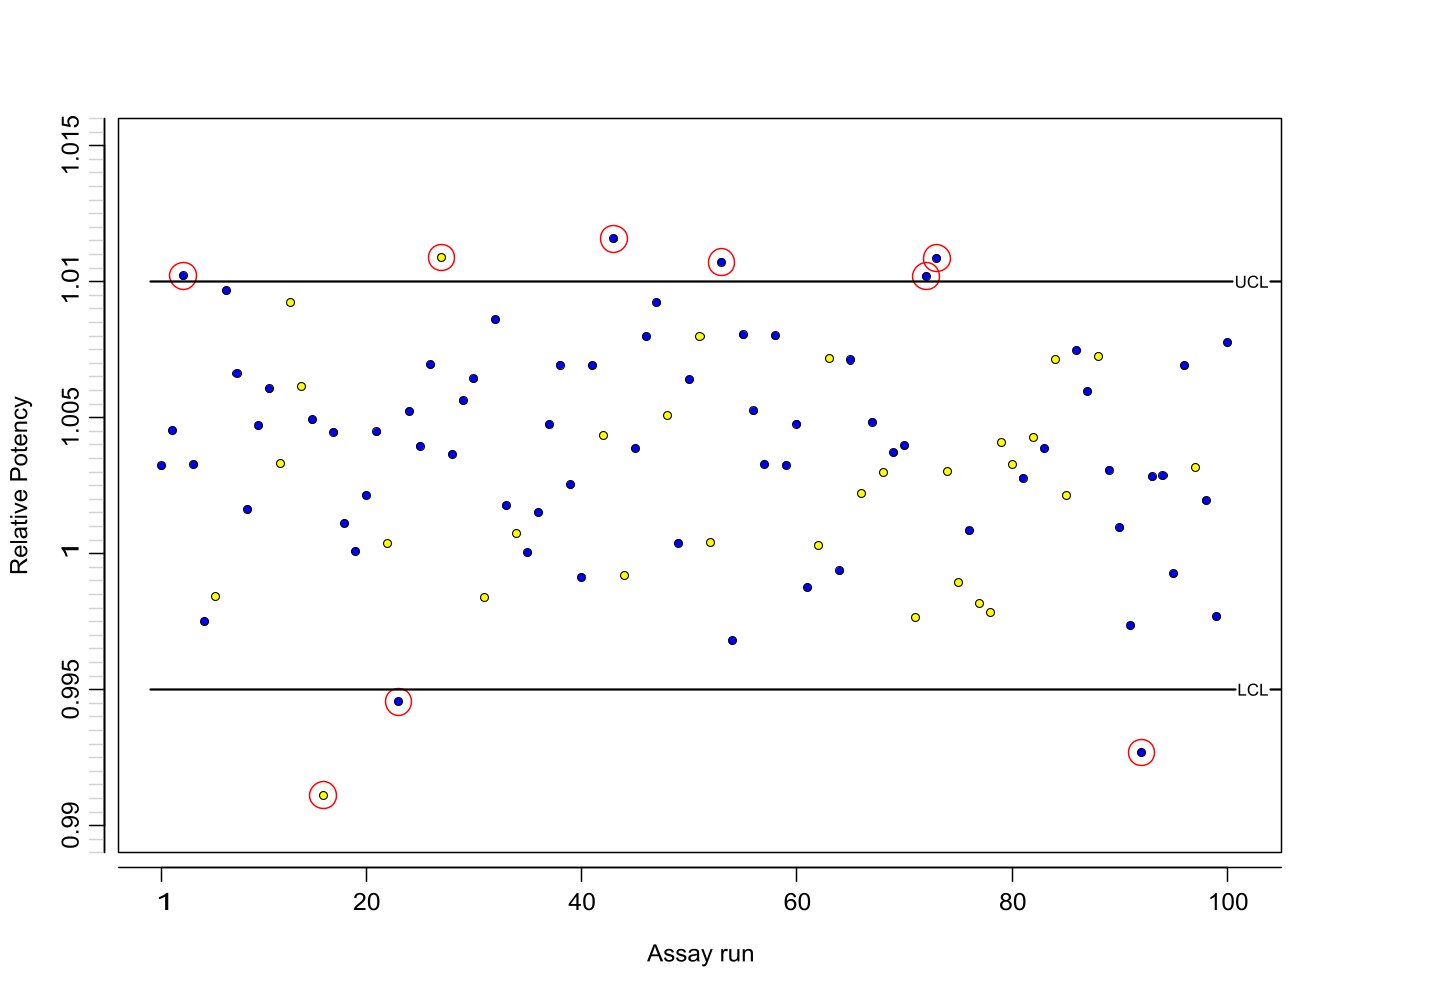
In the resulting plot, the observation values are plotted in the color according to the operator who performed the assay.

