
Data analysis add-ons
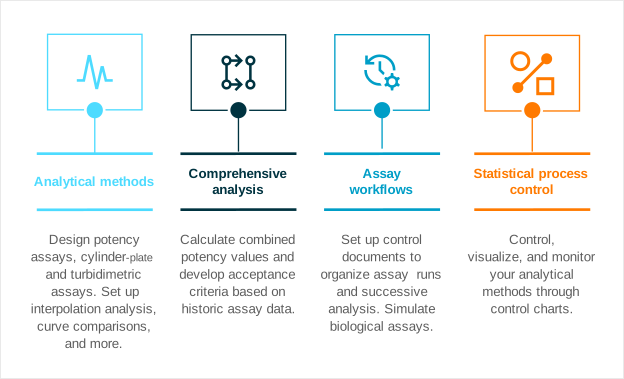
Data analysis add-ons provide ready-to-use analytical methods and capabilities for analyzing assays, combining results, organizing analytical workflows, and monitoring processes over time.
Analytical methods
Analyze individual assays using analytical methods for different assay types and analysis requirements.
Depending on the add-on, you can perform a range of analyses, including potency assays such as parallel-line, parallel-logistic, and slope-ratio assays, as well as endotoxin detection and microbial assays, curve comparisons, interpolation analyses, ECx calculations, and other analytical methods.
Which analytical methods are available to you depends on the data analysis add-ons activated in your PLA 3.0 database. For an overview of all available methods, see the Analytical methods topic.
Comprehensive analysis
Combine results from multiple assays and use historical assay data for further statistical evaluation.
Depending on the analysis, you can calculate reportable potency values from independent assays, develop equivalence margins from aggregated assay data, or combine microbial assay results, apply confidence limits, check for outliers, and define statistical tests.
These capabilities build on the data aggregation function of PLA 3.0, allowing you to use results from individual analyses directly in further analyses without manual input. For details, see the Data aggregation topic.
-
Biological Assay Package: Combination of assay results and Equivalence margin development document types
-
Dose-Response Analysis Package: Equivalence margin development document type
-
Microbial Assays for Antibiotics Package: Combination of microbial assays document type
Assay workflows
Organize related assay runs and subsequent analyses into an analytical workflow.
Use control documents to coordinate quantitative response assays and their combination calculations, and provide a structured analytical flow from individual assay results towards reportable values.
-
Biological Assay Package: Basic bioassay protocol document type
Statistical process control
Control, visualize, and monitor your analytical methods through control charts.
Statistical process control capabilities let you visualize analytical data using features such as Shewhart I-Charts, intervals, subcharts, and sidecharts. You can use these visualizations to monitor process behavior and distinguish data using additional characteristics.
-
Control Chart Package: Control chart document type