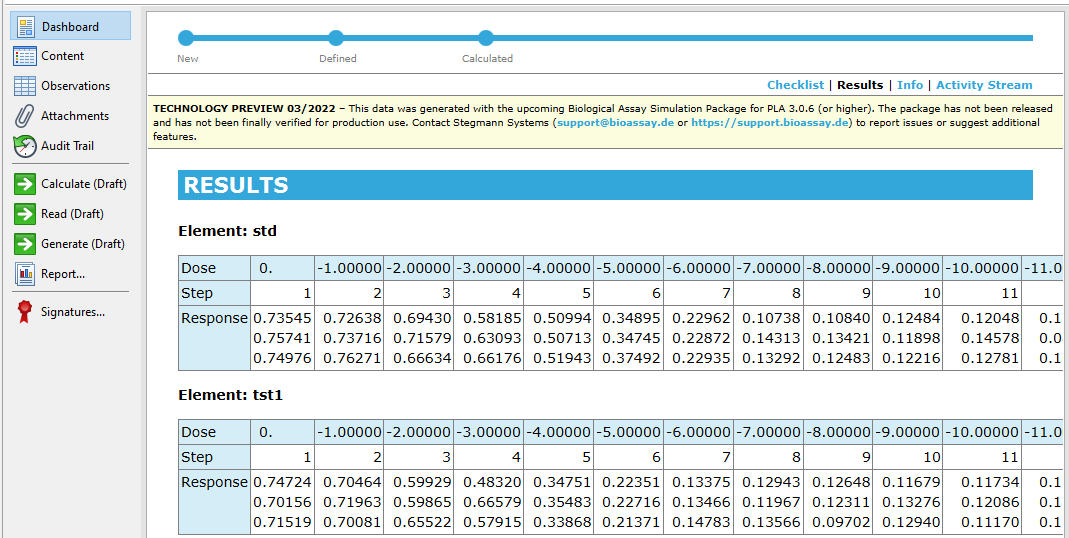
Simulate the assay data
After configuring the observations and the content of your QRA simulation document, you can create the simulated assays.
About this task
Response values are drawn from a normal distribution. Mean, variance, and the number of replicates are determined by the configuration of the observations and the content of the document. If the used mean should be calculated from a curve, the corresponding observation columns need to be filled and all other parameter columns need to be empty.
The corresponding columns are:
-
Linear model: Slope and Intercept
-
4PL-model: A, B, C, and D
-
5PL-model: A, B, C, D, and G
If you define parameter variances, PLA 3.0 determines new model parameters for each assay replicate using a normal distribution. Parameters need to be identical for all rows belonging to a single assay element.
Procedure
What to do next
Inspect the generated observations using the dashboard and the report.